Tag: tech
-
Imposter Syndrome Is Not a Bug — It’s a Feature
(And I’ve been stuck in it for a while) There’s been a topic sitting in the back of my mind for months now… Quietly persistent, slightly annoying, and very real: Imposter syndrome. Not the occasional “oh wow I hope I know what I’m doing” moment… I’m talking about the kind that lingers. The kind that…
-
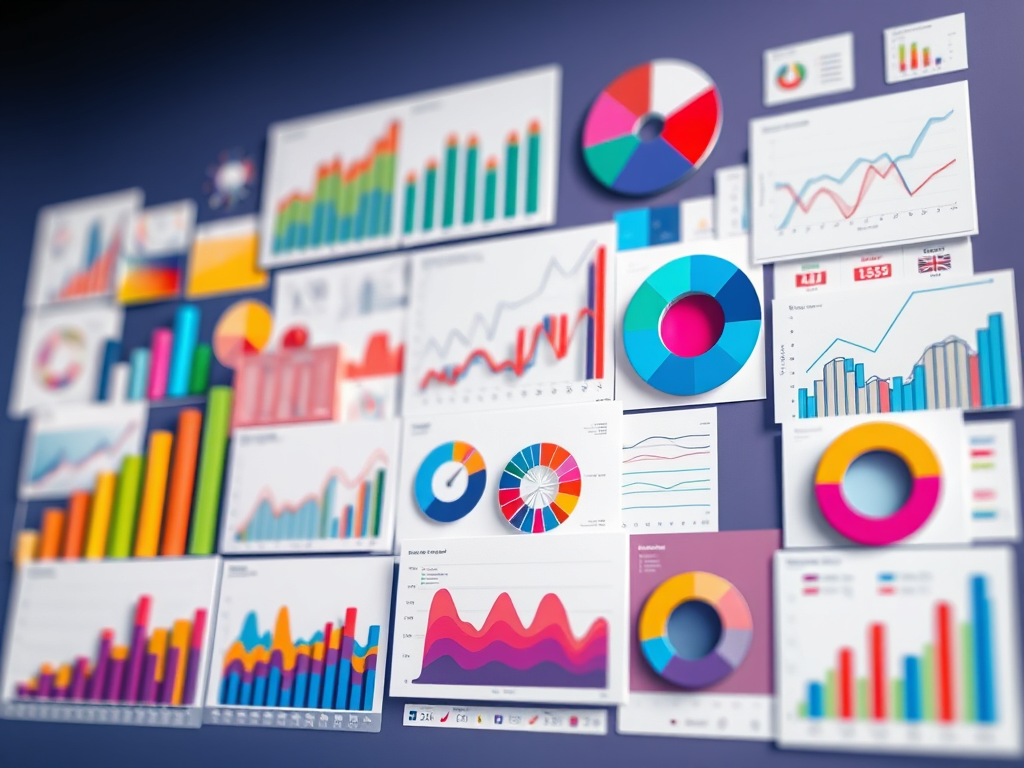
Chart Smarter, Not Harder: Choosing the Right Data Visualization
Let’s talk charts. Bar charts, line graphs, pie slices, scatter blobs — they all have their place, but picking the wrong one can turn your beautiful data into a confusing mess. So how do you know which one to use? Don’t worry — this isn’t a lecture. Think of it as a cheat sheet for…
-
The Story a Pie Chart Can Tell (Besides “I’m Hungry”) 🥧
Let’s be honest — pie charts don’t always get the respect they deserve. People love to drag them for being basic or not “serious” enough, but sometimes simple is exactly what you need. At a glance, a pie chart shows you who’s taking up the most space — whether that’s in your budget, your time,…
-
The Easiest Way to Understand Data? Start by Counting
Let’s be real: when most people hear “data,” their brain jumps to complicated dashboards, business meetings, or math class nightmares. But the truth is, data isn’t just for tech people or number nerds. It starts with something you’ve been doing since childhood: 👉 Counting things 👉 Sorting them into categories That’s it. That’s the origin…
-

🎆 Figure Friday: The Firework Economy 🎇
Let’s be real, nothing says “Happy Birthday, America!” quite like the smell of barbecue, the sight of red-white-and-blue everything, and the sky absolutely popping off with fireworks. But behind all the sparkle and sizzle is a surprisingly booming business. Welcome to this week’s Figure Friday, where we crunch the numbers behind the Fourth of July.…
-
🦆 Weird Data Wednesday: The Great Rubber Duck Spill of 1992
Let’s talk about one of the most unexpected (and oddly adorable) data stories to ever hit the high seas: the accidental global journey of 28,000 rubber ducks. Yes, really. In 1992, a shipping container filled with plastic bath toys, ducks, frogs, turtles, and beavers, fell overboard in the North Pacific Ocean. Instead of sinking, the…
-
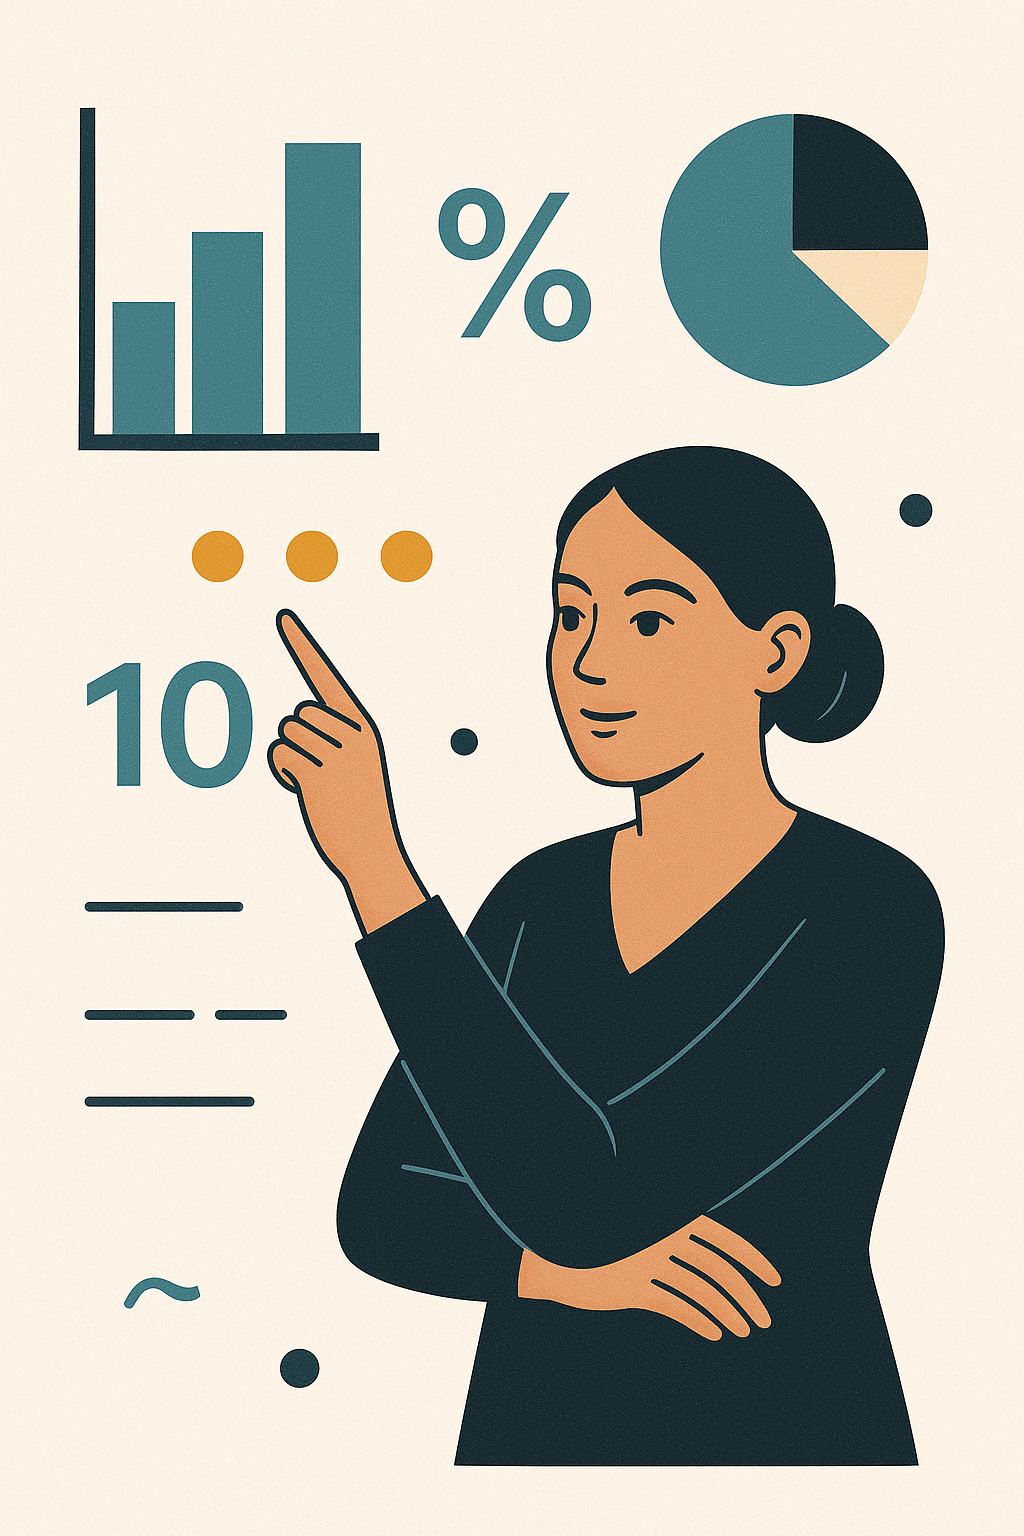
Understanding Percentages in Everyday Life
From lattes to late fees, percentages are everywhere. Let’s be honest—percentages don’t get a lot of hype. They’re not flashy like “AI” or mysterious like “the algorithm,” but they’re one of the most quietly useful tools we use all the time without realizing it. If you’ve checked your phone battery, glanced at a sale tag,…
-
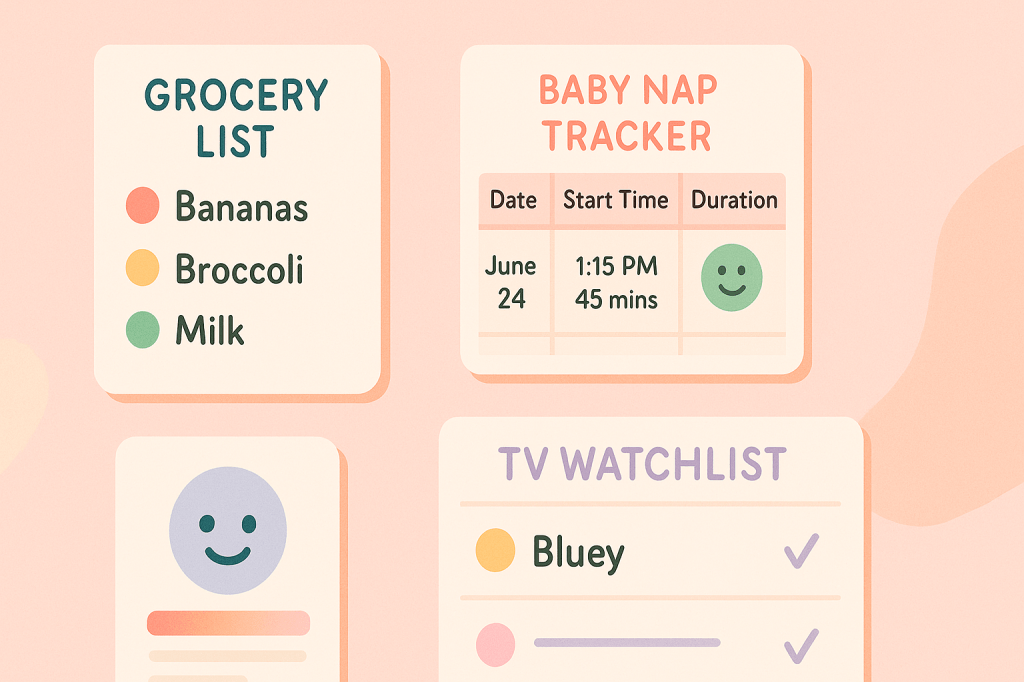
What’s a Dataset, Anyway?
(And Why You’ve Made One Without Even Knowing It) Let’s play a quick game: Have you ever made a grocery list? Tracked your baby’s nap schedule? Kept a log of screen time, meals, chores, or (let’s be real) your toddler’s tantrums? 🎉 Ding ding! You’ve made a dataset. Yep. Even if you’ve never touched Excel…
-

Intro to Tables: Rows, Columns, and What They Mean
Let’s talk tables — not the ones you eat at, but the ones that help organize data. If you’ve ever opened a spreadsheet and felt a wave of confusion, you’re not alone. Tables aren’t as intimidating as they seem. In fact, they’re just a neat way to line up your information so it makes sense.…
-

Figure Friday: You’ve Already Checked Your Phone Today (Probably 96 Times)
Did you just check your phone before reading this? Be honest. If you did, you’re in good company. Most of us do! In fact, a recent study by Asurion found that the average person checks their phone 96 times a day. That’s once every 10–12 minutes we’re awake. I’d bet my last cold cup of…
