Tag: ai
-

Data Cleaning: The Laundry Day of Analytics
If you’ve ever tried to do analysis without cleaning your data first, you know it feels a little like trying to fold laundry straight out of the dryer — wrinkled socks hiding in sleeves, mystery stains popping up when you least expect it, and way too many unmatched pairs. 🧺 That’s where data cleaning comes…
-

A Beginner’s Guide to Structured, Semi-Structured, and Unstructured Data
If you’ve ever dipped a toe into the world of data, you’ve probably heard terms like “structured,” “semi-structured,” and “unstructured.” At first, they can sound like something out of a tech textbook, but they’re really just different ways of describing how organized (or not) your data is. Think of it like the way you organize…
-
Why Context in Data Turns Numbers Into Real Insights
Here’s the thing—data without context is just… numbers. Maybe they look nice on a dashboard, maybe they’re color-coded in your favorite shade of green, but without context, they’re about as useful as a GPS with no location. You can stare at them all day, but you won’t know where to go next. Think about it—if…
-
Chart Smarter, Not Harder: Choosing the Right Data Visualization
Let’s talk charts. Bar charts, line graphs, pie slices, scatter blobs — they all have their place, but picking the wrong one can turn your beautiful data into a confusing mess. So how do you know which one to use? Don’t worry — this isn’t a lecture. Think of it as a cheat sheet for…
-

Red Flags in Data: What to Look For
Let’s be real — data is everywhere. On your phone, in your inbox, tucked into pie charts during boring meetings. But not all data is trustworthy. Sometimes, data has ✨ red flag energy ✨ — and it’s our job to spot it before we run off making decisions based on it. So how can you…
-
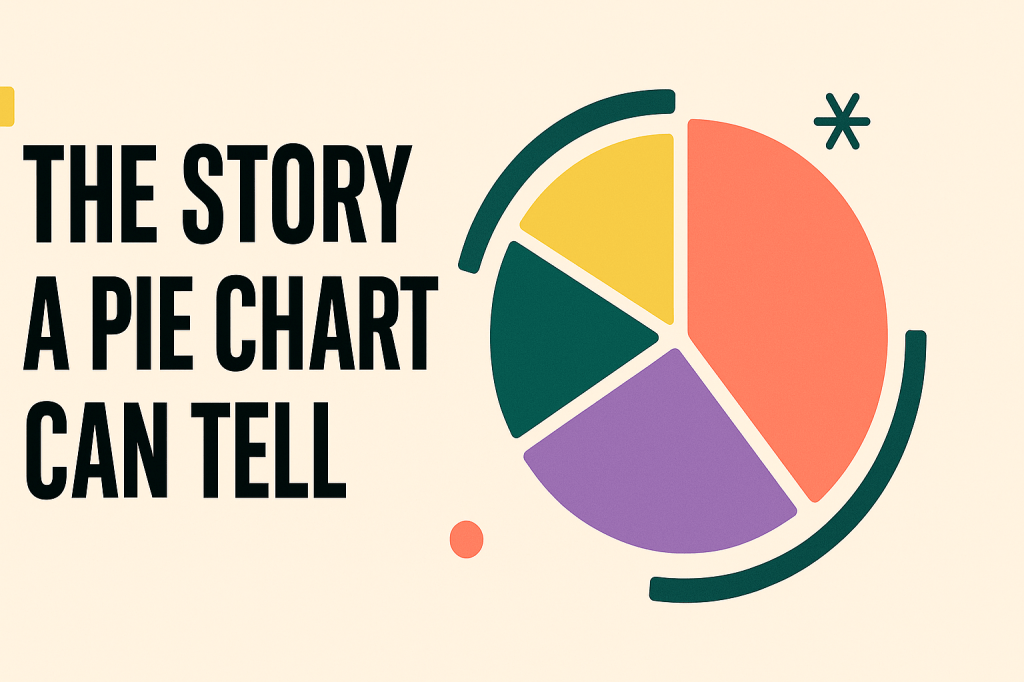
The Story a Pie Chart Can Tell (Besides “I’m Hungry”) 🥧
Let’s be honest — pie charts don’t always get the respect they deserve. People love to drag them for being basic or not “serious” enough, but sometimes simple is exactly what you need. At a glance, a pie chart shows you who’s taking up the most space — whether that’s in your budget, your time,…
-

The Easiest Way to Understand Data? Start by Counting
Let’s be real: when most people hear “data,” their brain jumps to complicated dashboards, business meetings, or math class nightmares. But the truth is, data isn’t just for tech people or number nerds. It starts with something you’ve been doing since childhood: 👉 Counting things 👉 Sorting them into categories That’s it. That’s the origin…
-

🎆 Figure Friday: The Firework Economy 🎇
Let’s be real, nothing says “Happy Birthday, America!” quite like the smell of barbecue, the sight of red-white-and-blue everything, and the sky absolutely popping off with fireworks. But behind all the sparkle and sizzle is a surprisingly booming business. Welcome to this week’s Figure Friday, where we crunch the numbers behind the Fourth of July.…
-
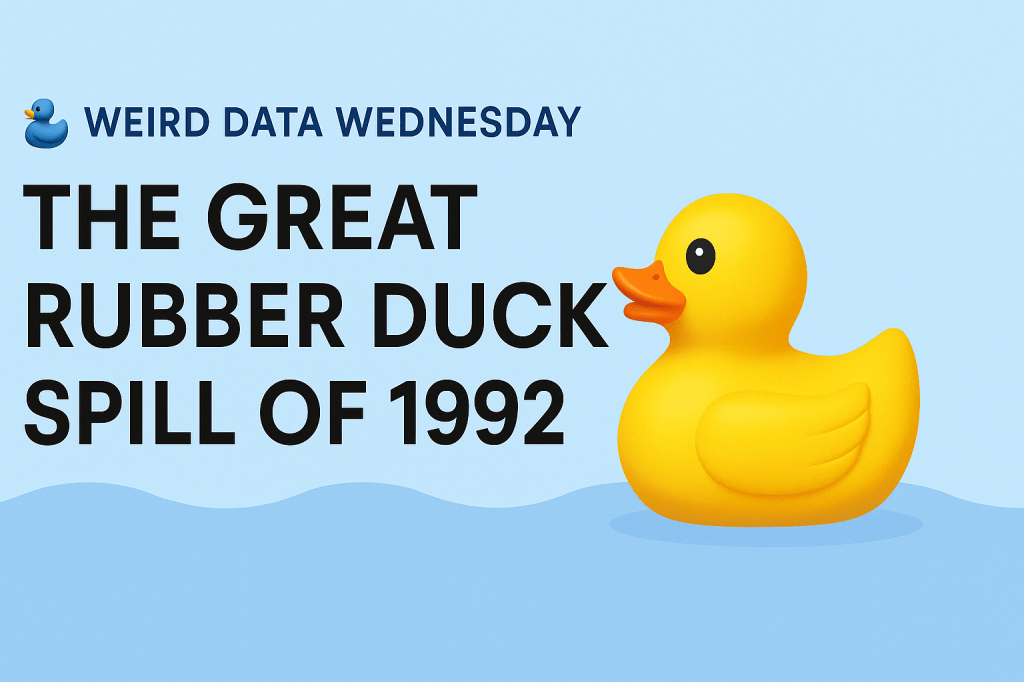
🦆 Weird Data Wednesday: The Great Rubber Duck Spill of 1992
Let’s talk about one of the most unexpected (and oddly adorable) data stories to ever hit the high seas: the accidental global journey of 28,000 rubber ducks. Yes, really. In 1992, a shipping container filled with plastic bath toys, ducks, frogs, turtles, and beavers, fell overboard in the North Pacific Ocean. Instead of sinking, the…
-
Understanding Percentages in Everyday Life
From lattes to late fees, percentages are everywhere. Let’s be honest—percentages don’t get a lot of hype. They’re not flashy like “AI” or mysterious like “the algorithm,” but they’re one of the most quietly useful tools we use all the time without realizing it. If you’ve checked your phone battery, glanced at a sale tag,…
