- Imposter Syndrome Is Not a Bug — It’s a Feature

- Data Cleaning: The Laundry Day of Analytics

- A Beginner’s Guide to Structured, Semi-Structured, and Unstructured Data

- Why Context in Data Turns Numbers Into Real Insights

- Comparisons, Trends, and Changes Over Time: Making Data Actually Useful

- Chart Smarter, Not Harder: Choosing the Right Data Visualization

- Red Flags in Data: What to Look For

- Making Choices with Data

- The Story a Pie Chart Can Tell (Besides “I’m Hungry”) 🥧

- The Easiest Way to Understand Data? Start by Counting

- 🎆 Figure Friday: The Firework Economy 🎇

- 🦆 Weird Data Wednesday: The Great Rubber Duck Spill of 1992

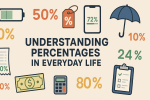
- Understanding Percentages in Everyday Life
- What’s a Dataset, Anyway?

- Intro to Tables: Rows, Columns, and What They Mean

- Figure Friday: You’ve Already Checked Your Phone Today (Probably 96 Times)

- Analyzing My Toddler’s Tantrums (So I Don’t Cry Into My Coffee)

- What Is the Data Lifecycle? A Beginner’s Guide

- Patterns Are Data in Disguise

- Charts Made Simple: See the Story, Skip the Stress

- Unlocking the Power of Data Through Questions

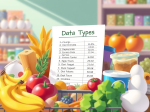
- Meet the Data Types: Words, Numbers & Everything in Between
- You Already Use Data Every Day — Here’s How

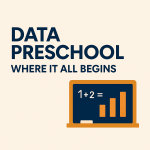
- Data Preschool: Where It All Begins
-
Subscribe
Subscribed
Already have a WordPress.com account? Log in now.
