Category: Fun Data Posts
-

🎆 Figure Friday: The Firework Economy 🎇
Let’s be real, nothing says “Happy Birthday, America!” quite like the smell of barbecue, the sight of red-white-and-blue everything, and the sky absolutely popping off with fireworks. But behind all the sparkle and sizzle is a surprisingly booming business. Welcome to this week’s Figure Friday, where we crunch the numbers behind the Fourth of July.…
-
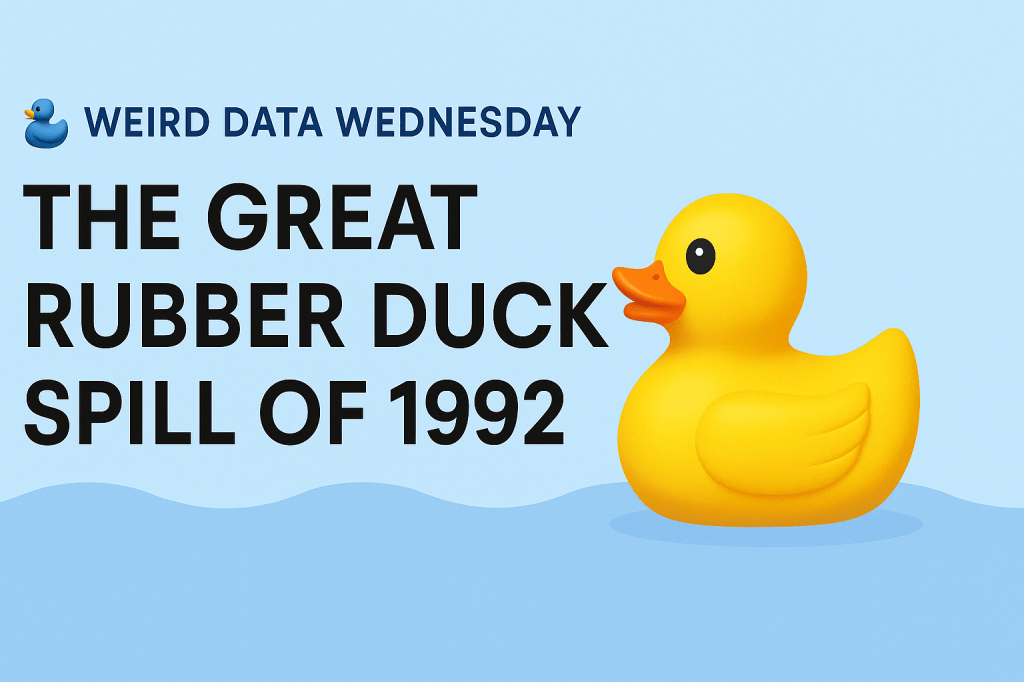
🦆 Weird Data Wednesday: The Great Rubber Duck Spill of 1992
Let’s talk about one of the most unexpected (and oddly adorable) data stories to ever hit the high seas: the accidental global journey of 28,000 rubber ducks. Yes, really. In 1992, a shipping container filled with plastic bath toys, ducks, frogs, turtles, and beavers, fell overboard in the North Pacific Ocean. Instead of sinking, the…
-

Figure Friday: You’ve Already Checked Your Phone Today (Probably 96 Times)
Did you just check your phone before reading this? Be honest. If you did, you’re in good company. Most of us do! In fact, a recent study by Asurion found that the average person checks their phone 96 times a day. That’s once every 10–12 minutes we’re awake. I’d bet my last cold cup of…
