Category: Data Jr. High
-

Data Cleaning: The Laundry Day of Analytics
If you’ve ever tried to do analysis without cleaning your data first, you know it feels a little like trying to fold laundry straight out of the dryer — wrinkled socks hiding in sleeves, mystery stains popping up when you least expect it, and way too many unmatched pairs. 🧺 That’s where data cleaning comes…
-

Comparisons, Trends, and Changes Over Time: Making Data Actually Useful
You know how sometimes you look at a single number and think, “Okay…but is that good?” That’s because one number on its own doesn’t give us much context. The real insights show up when we compare it to something else, track it over time, or see how it changes after something happens. That’s where comparisons,…
-
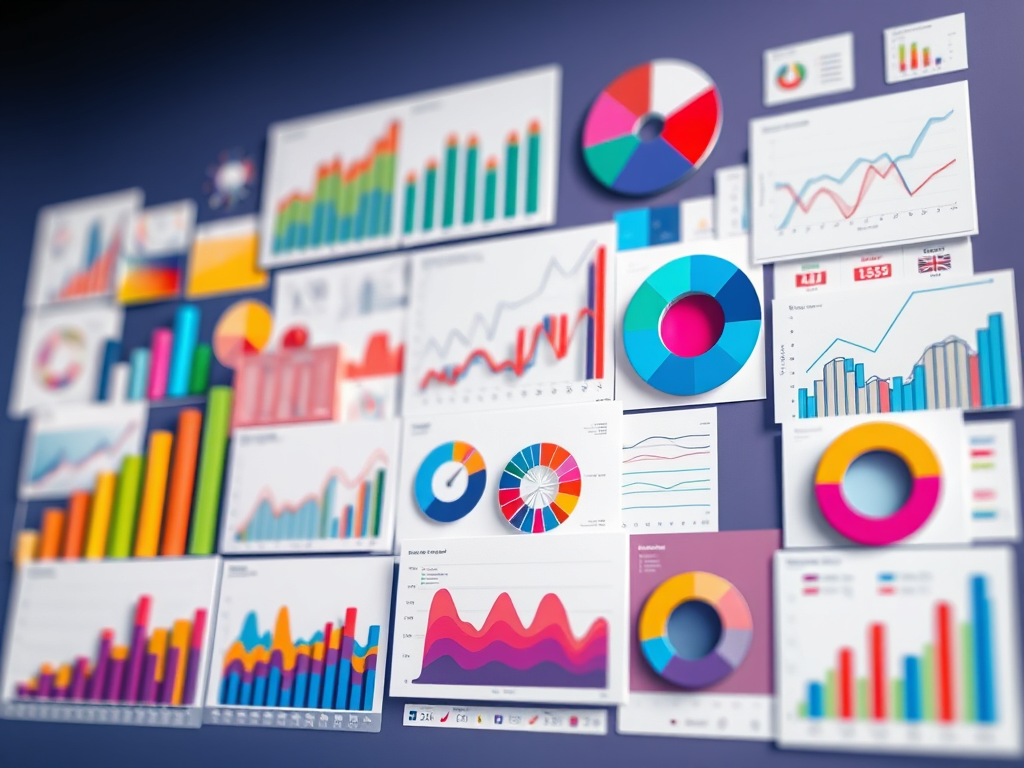
Chart Smarter, Not Harder: Choosing the Right Data Visualization
Let’s talk charts. Bar charts, line graphs, pie slices, scatter blobs — they all have their place, but picking the wrong one can turn your beautiful data into a confusing mess. So how do you know which one to use? Don’t worry — this isn’t a lecture. Think of it as a cheat sheet for…
